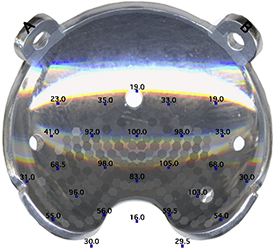
For this example, simulated annealing of the surface strength distribution, followed by manual fine tuning, eventually achieved a near-surface RMS % error of about 12 and a central axis RMS % error of about 3.37 over the range 0..10 mm between the patch source model calculations and measurements.
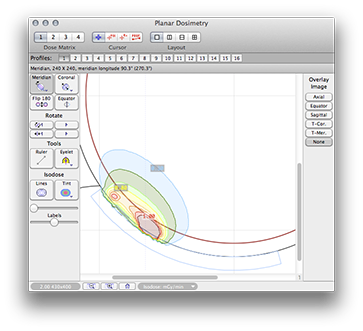
Normalized isodose distribution on the meridian plane which passes through the plaque center.
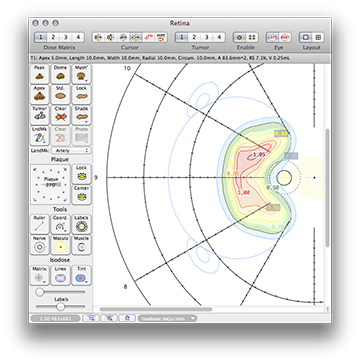
Normalized isodose distribution on the retinal diagram.