
|
In TDF Plan, the conventional LQ model is used when the course modality is EBRT. Course modality is set from the modality popup menu in the IMR group. The linear-quadratic (LQ) formulation e-(αD+βD2) is often used to model biological response to radiation. For instance, when applied to single fraction cell survival studies the surviving fraction (SF) is generally expressed as: SF = e-(αD+βD2) where D is the dose in Gy, α is the cell kill per Gy of the initial linear component (on a log-linear plot) and β the cell kill per Gy2 of the quadratic component of the survival curve. Curves for the individual LQ components e-αD and e-βD2intersect at the dose where the αD and βD2 components of cell killing are equal. This intersection happens to occur at a dose equal to the ratio of α to β, and is often referred to in the literature simply as α/β. The biological effect (E) per fraction (n) of fractional dose (D) can be expressed as: En = (αD+βD2) The biologically effective dose (BED or E/α) is an approximate quantity by which different radiotherapy fractionation regimens may be intercompared. For instance, for an external beam radiotherapy (EBRT) regimen employing n equal fractions of conventional size the BED will be: BED = E/α = nD (1 + (D / (α/β))) where n = number of fractions, D = dose/fraction, and nD = total dose.This formulation assumes that full repair occurs between fractions so that the biological effect of each fraction is the same. Many extensions to the LQ and BED formulations have been developed to account for temporal phenomena such as sublethal repair and repopulation which can occur during lengthy fractionated regimens. It is also convention to express BED in units of Gyα/β to indicate the effects to which the result apply. It is not meaningful to add the BED of partial acute effects (e.g. Gy10) to the BED for partial late reactions (e.g. Gy3). The earlier TDF model of Orton and Ellis (1973) based on the Nominal Standard Dose (NSD) model of Ellis is also implemented in TDF Plan for historical reference and comparison. |
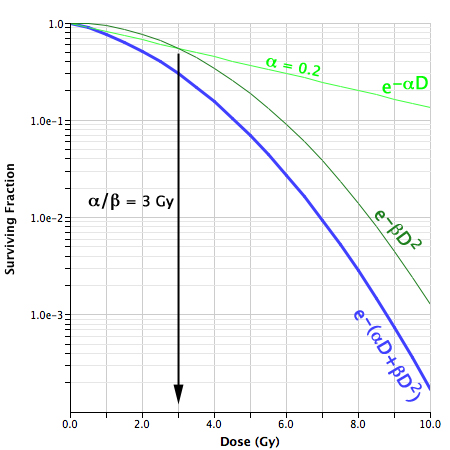
A survival curve using the standard LQ formula e-(αD+βD2) where α = 0.2 and α/β = 3. The components of cell killing are equal where the curves e-αD and e-βD2 intersect. This occurs at dose D = α/β (3 Gy in this example). |
|
In TDF Plan, the LQ-L model is used whenever the course modality is SBRT or SRS. Course modality is set from the modality popup menu in the IMR group. Although BED calculations appear to be a fairly reliable tool for intercomparing conventional fractionation regimens, the standard LQ formulation upon which these calculations rests is suspect for fractions of very high dose. As explained by Hall (1); A characteristic of the linear-quadratic formulation is that the resultant cell-survival curve is continuously bending; there is no final straight portion. This does not coincide with what is observed experimentally if survival curves are determined down to seven or more decades of cell killing, in which case the dose-response relationship closely approximates to a straight line in a log-linear plot. To better address hypofractionation regimens (e.g. SBRT, SRS) which employ very high dose fractions Guerrero and Li (5) modified the LQ model to better fit iso-effect data at high doses. Park et al. (6) later proposed that the LQ model transition to the historic multitarget (MT) model above a specified dose DT. TDF Plan implements the transition to a linear tail at high dose using the LQ-L model described by Astrahan (7). |
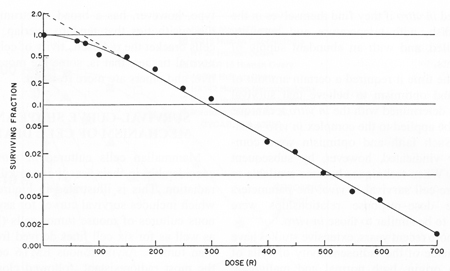
A classic example of in vivo cell survival illustrating the linear tail (on a log-linear plot) of the cell survival curve at high dose where cell killing becomes purely exponential. Figure was scanned from Hall's textbook (1) in which it was reproduced from Puck TT, Markus PI. Action of x-rays on mammalian cells. J Exp Med 1956; 103:653-666 |
|
In the standard LQ formalism, the surviving fraction (SF) and biologically effective dose per fraction (BEDn) are expressed as:
SF = e-(αD+βD2) To transition to a linear model for very high dose fractions the standard LQ model can be extended to a bipartite LQα/β-LDTform which can be expressed as:
SF = e-(αD+βD2) for fraction size D < DT
BEDn = (D + D2/(α/β)) for fraction size D < DT where DT is the dose at which the survival curve becomes linear and γ is the the cell kill per Gy in this high dose linear portion of the survival curve. The term γ is thus reminiscent of D0 (the dose that reduces survival by 1/e in the final linear portion of the survival curve) of the older multitarget survival model, but is more in keeping with the Greek nomenclature of the LQ model. The γ/α ratio can be calculated from the tangent at DT and the α/β term of the standard LQ model as: γ/α = 1 + (2DT/(α/β)) |
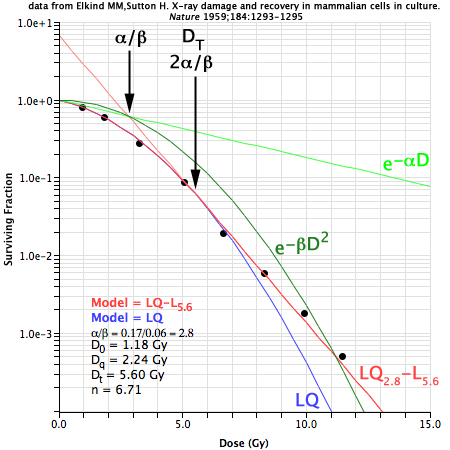
A classic example of in vivo Chinese Hamster cell survival illustrating the linear tail (on a log-linear plot) of the cell survival curve at high dose where cell killing becomes purely exponential. |
|
Using the bipartite LQα/β-LDT model, the terms α, α/β, DT and γ can accurately model the survival curve across a very wide range of dose. In many instances the final slope γ can be approximated as the tangent to the LQ formula at transition dose DT. Optimally, DT will be determined by directly fitting an experimental dose response curve, but in some cases DT can be estimated from a priori or a posteriori knowledge of α/β ratios. An estimate for DT that seems to fit a wide variety of published cell survival and dose-response data for α/β in the range 1 to 10 may be 2α/β as illustrated to the right. Interestingly, when DT = 2α/β, the line tangent to DT intersects the point at which αD cell kill equals βD2 cell kill. It is unknown at this time if this phenomenon is linked to some underlying biological mechanism or if it is simply an artifact of the LQ model. Note that the 2α/β estimate occasionally fails for dose-response curves with exceptionally broad flat shoulders (7) because in some cases the α component of cell kill approaches zero and sometimes dose-response becomes almost bilinear instead of linear-quadratic-linear. The term DT certainly has intuitive clinical significance since it describes the dose at which the linear-quadratic portion of the survival curve ends and the final linear portion begins. DT can be preset via a field in the TDFBiology.txt tissue library files, manually set, or automatically constrained to equal 2α/β. The 2α/β values for DT currently in TDF Plan are speculative and BED calculations for hypofractionated SBRT regimens which use the LQ-L model should be carefully evaluated before applying to any clinical situation. |
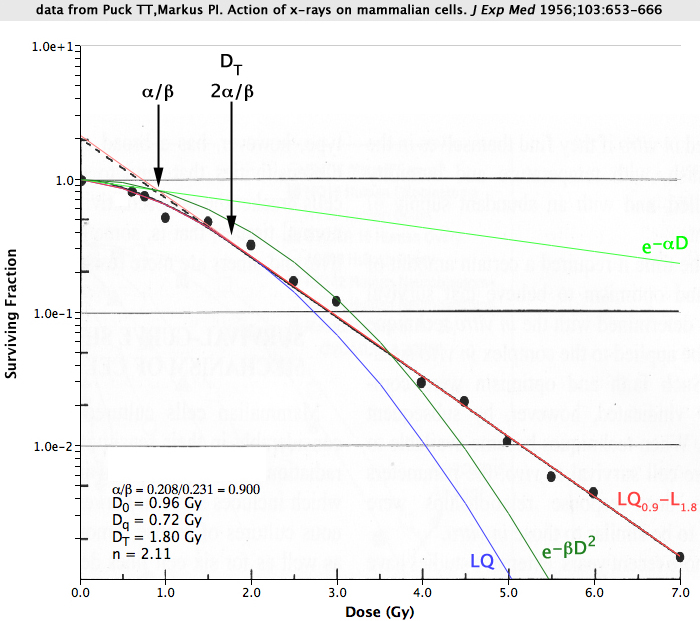
In this figure LQ (blue) and LQ-L (red) curves are superimposed over a rescaled version of the classic survival plot for human HeLa cells shown earlier on this page. The standard LQ formula (blue) bends continuously whereas the LQ-L bipartite model (red) transitions to linear beyond dose DT. For LQ-L parameters of α = 0.208, α/β = 0.9 and DT = 1.8 Gy the LQ-L curve precisely overlays the original curve (black) that was drawn by Puck and Marcus in 1956. Also note that when DT = 2α/β, the line tangent to DT (light red) intersects the same point at which αD (light green) cell kill equals βD2 (dark green) cell kill at dose D = α/β Gy. |
|
For low dose rate (LDR) brachytherapy BED = d (1 + ((gd) / (α/β))) where g is a term which shows how much less effective the repairable (β) component of damage has become because of the prolonged duration of the exposure. If repair is assumed to occur at rate u theng = (2 / μT) x (1 − ((1−exp(−μT))/μT)). |
|