Madena provides the functions bias & gain as an alternative to brightness and contrast for image enhancement. The bias and gain functions were first described by Perlin and Hoffert (K. Perlin and E. Hoffert, Hypertexture, Computer Graphics, 23(3):287-296, 1989). The faster alternative method of Schlick (C. Schlick, Fast Alternatives to Perlin's Bias and Gain Functions, Graphic Gems IV, P. Heckbert ed., 401-403, 1994) is implemented in Madena.
The objective of the bias function is to alter the display in favor of either its low or high values. Gain increases or decreases the gradient of a function around a given point. The examples below use the MRI brain.dcm sample file to illustrate the effects of bias and gain.
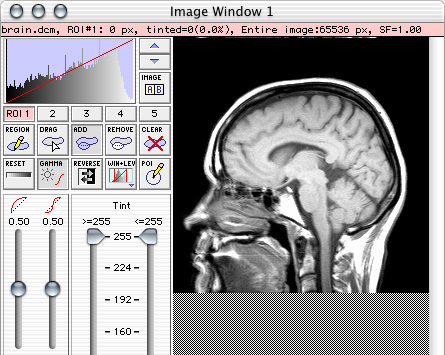
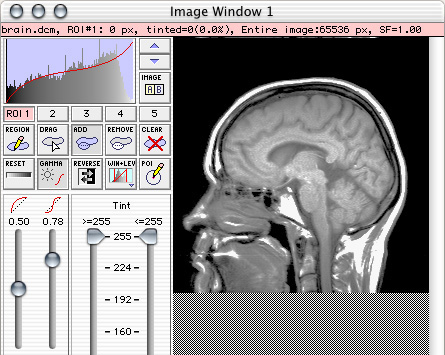
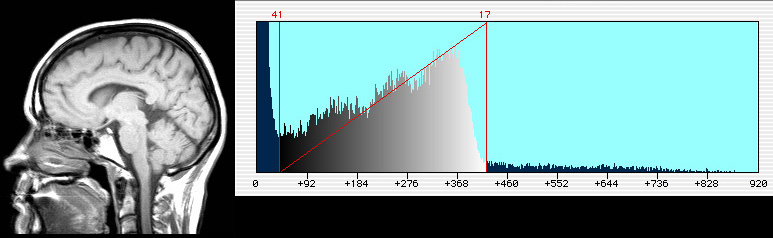
To enable bias & gain click the "Gamma" button. The brightness slider will now control the bias function and the contrast slider will control the gain function. To return to brightness and contrast, click the "Gamma" button again. When both sliders at at midpoint (0.5), the display is in its default condition. The result is a uniform gradient between black and white, illustrated by the red line displayed over the histogram.
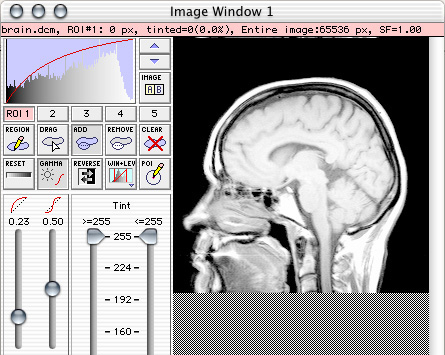
When the bias is taken to a value below 0.5, the display gradient is steeper at the low (black) end of the histogram. The visual result is additional "contrast" between anatomical structures represented by dark shades of gray, and less contrast between the brighter structures.
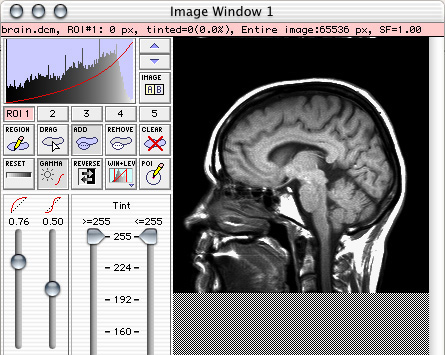
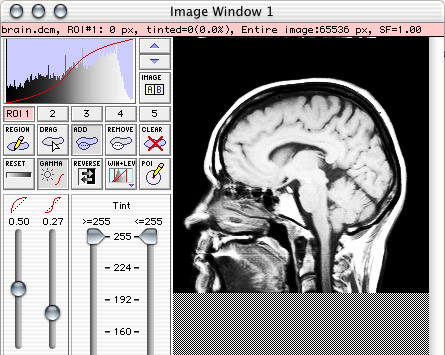
When the bias is taken to a value above 0.5, the display gradient is steeper at the high (white) end of the histogram. The visual result is additional "contrast" between anatomical structures represented by bright shades of gray, and less contrast between the darker structures.
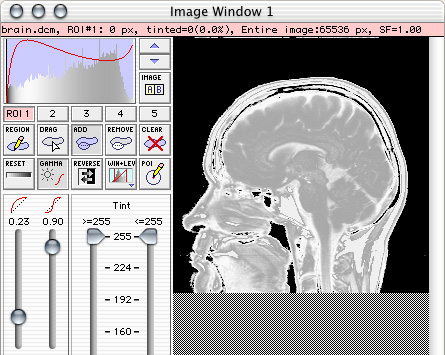
When the gain is taken to a value above 0.5, the display gradient is flatter near the center of the histogram. The visual result is less "contrast" between anatomical structures represented by the middle shades of gray, and greater contrast between the brighter and darker structures.
When the gain is taken to a value below 0.5, the display gradient is steeper near the center of the histogram. The visual result is additional "contrast" between anatomical structures represented by the middle shades of gray, and less contrast between the brighter and darker structures.
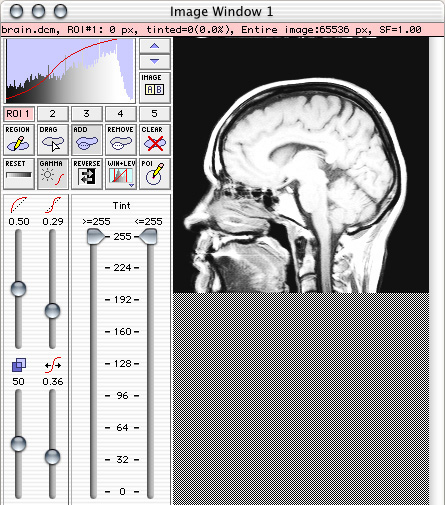
The gain point slider introduced in Madena 2.1 shifts the gain inflection point (m). In the example below the gain point has been shifted from the default 0.50 left to 0.36. This moves the region of steepest gain towards the darker end of the original image.
You can combine bias & gain to create some interesting and entertaining (but perhaps not very useful) displays.
The bias & gain functions can also be applied to the raw 16-bit image data when it is being compressed via the window and level dialog. The first example below illustrates a smooth transition from black to white applied to the raw density range 40..421. Pixels outside this range display as black in the compressed 8-bit (256 level) image.
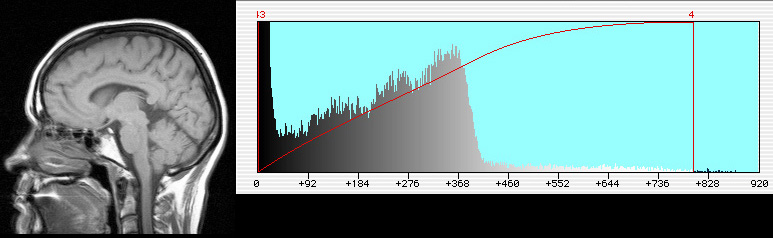
The final example below illustrates the use of bias and gain (click the gamma button in the dialog to switch to bias & gain mode if necessary, and then use the sliders) to expand the transition from black to white across the density range 0..800. This curve maintains a nearly uniform transition up to pixel density 400 and then rolls off as the densities approach 800. The purpose here is to allocate most of the 256 available gray levels to image pixel densities 0..400, and distribute what few shades of gray that remain to the few pixels above 400.